Zone Based Endurance Training
A basic primer to becoming an exceptional endurance athlete.

“Zone 3 is your friend, in moderation. Zone 4 is your acquaintance. And spending too much time with Zone 5 will end with you folded up in a car trunk somewhere outside Las Vegas.” - David Roche
Amidst social media circles, articles, and podcasts, “Zone-Based Training” has been a commonly referred-to concept, providing general guidelines for those looking to improve their physiological prowess in endurance sports. The proposed models (e.g., the 3-zone model and 5-zone model) have been utilized for decades at the highest levels of competition and are the cornerstone for many evolving training theories.
The 3-Zone Training Model
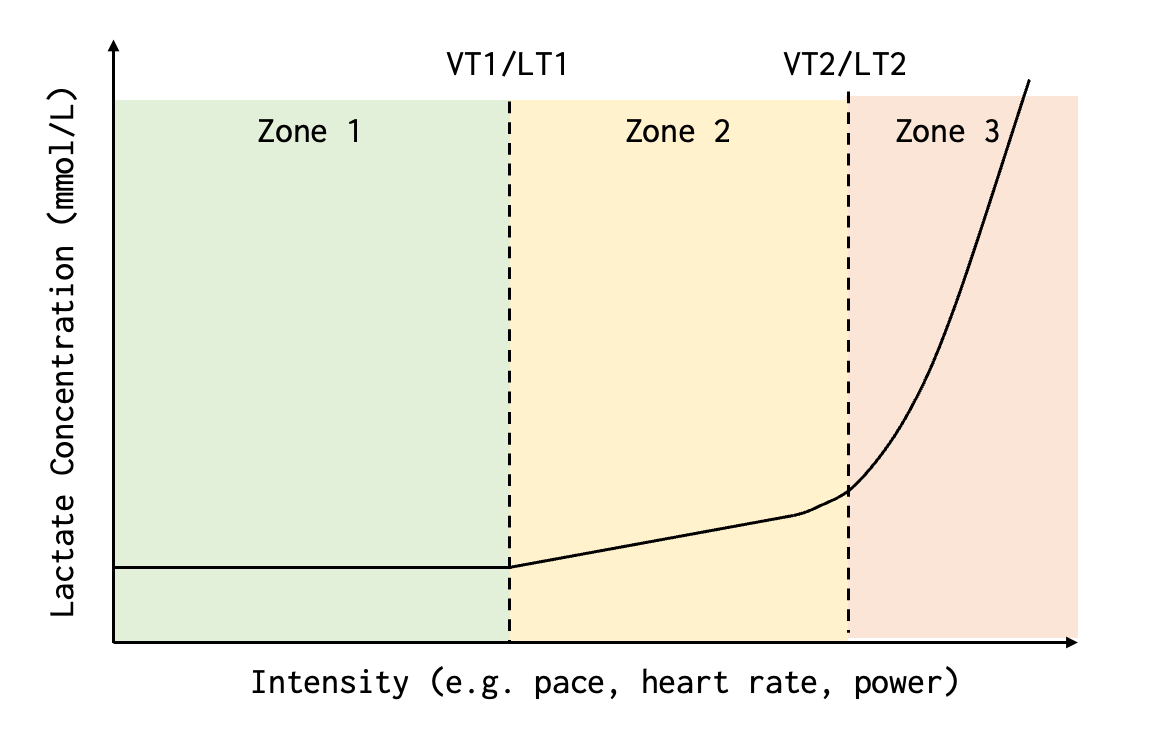
The 3-zone training model is commonly used for training distribution guidelines, prescription, and research.
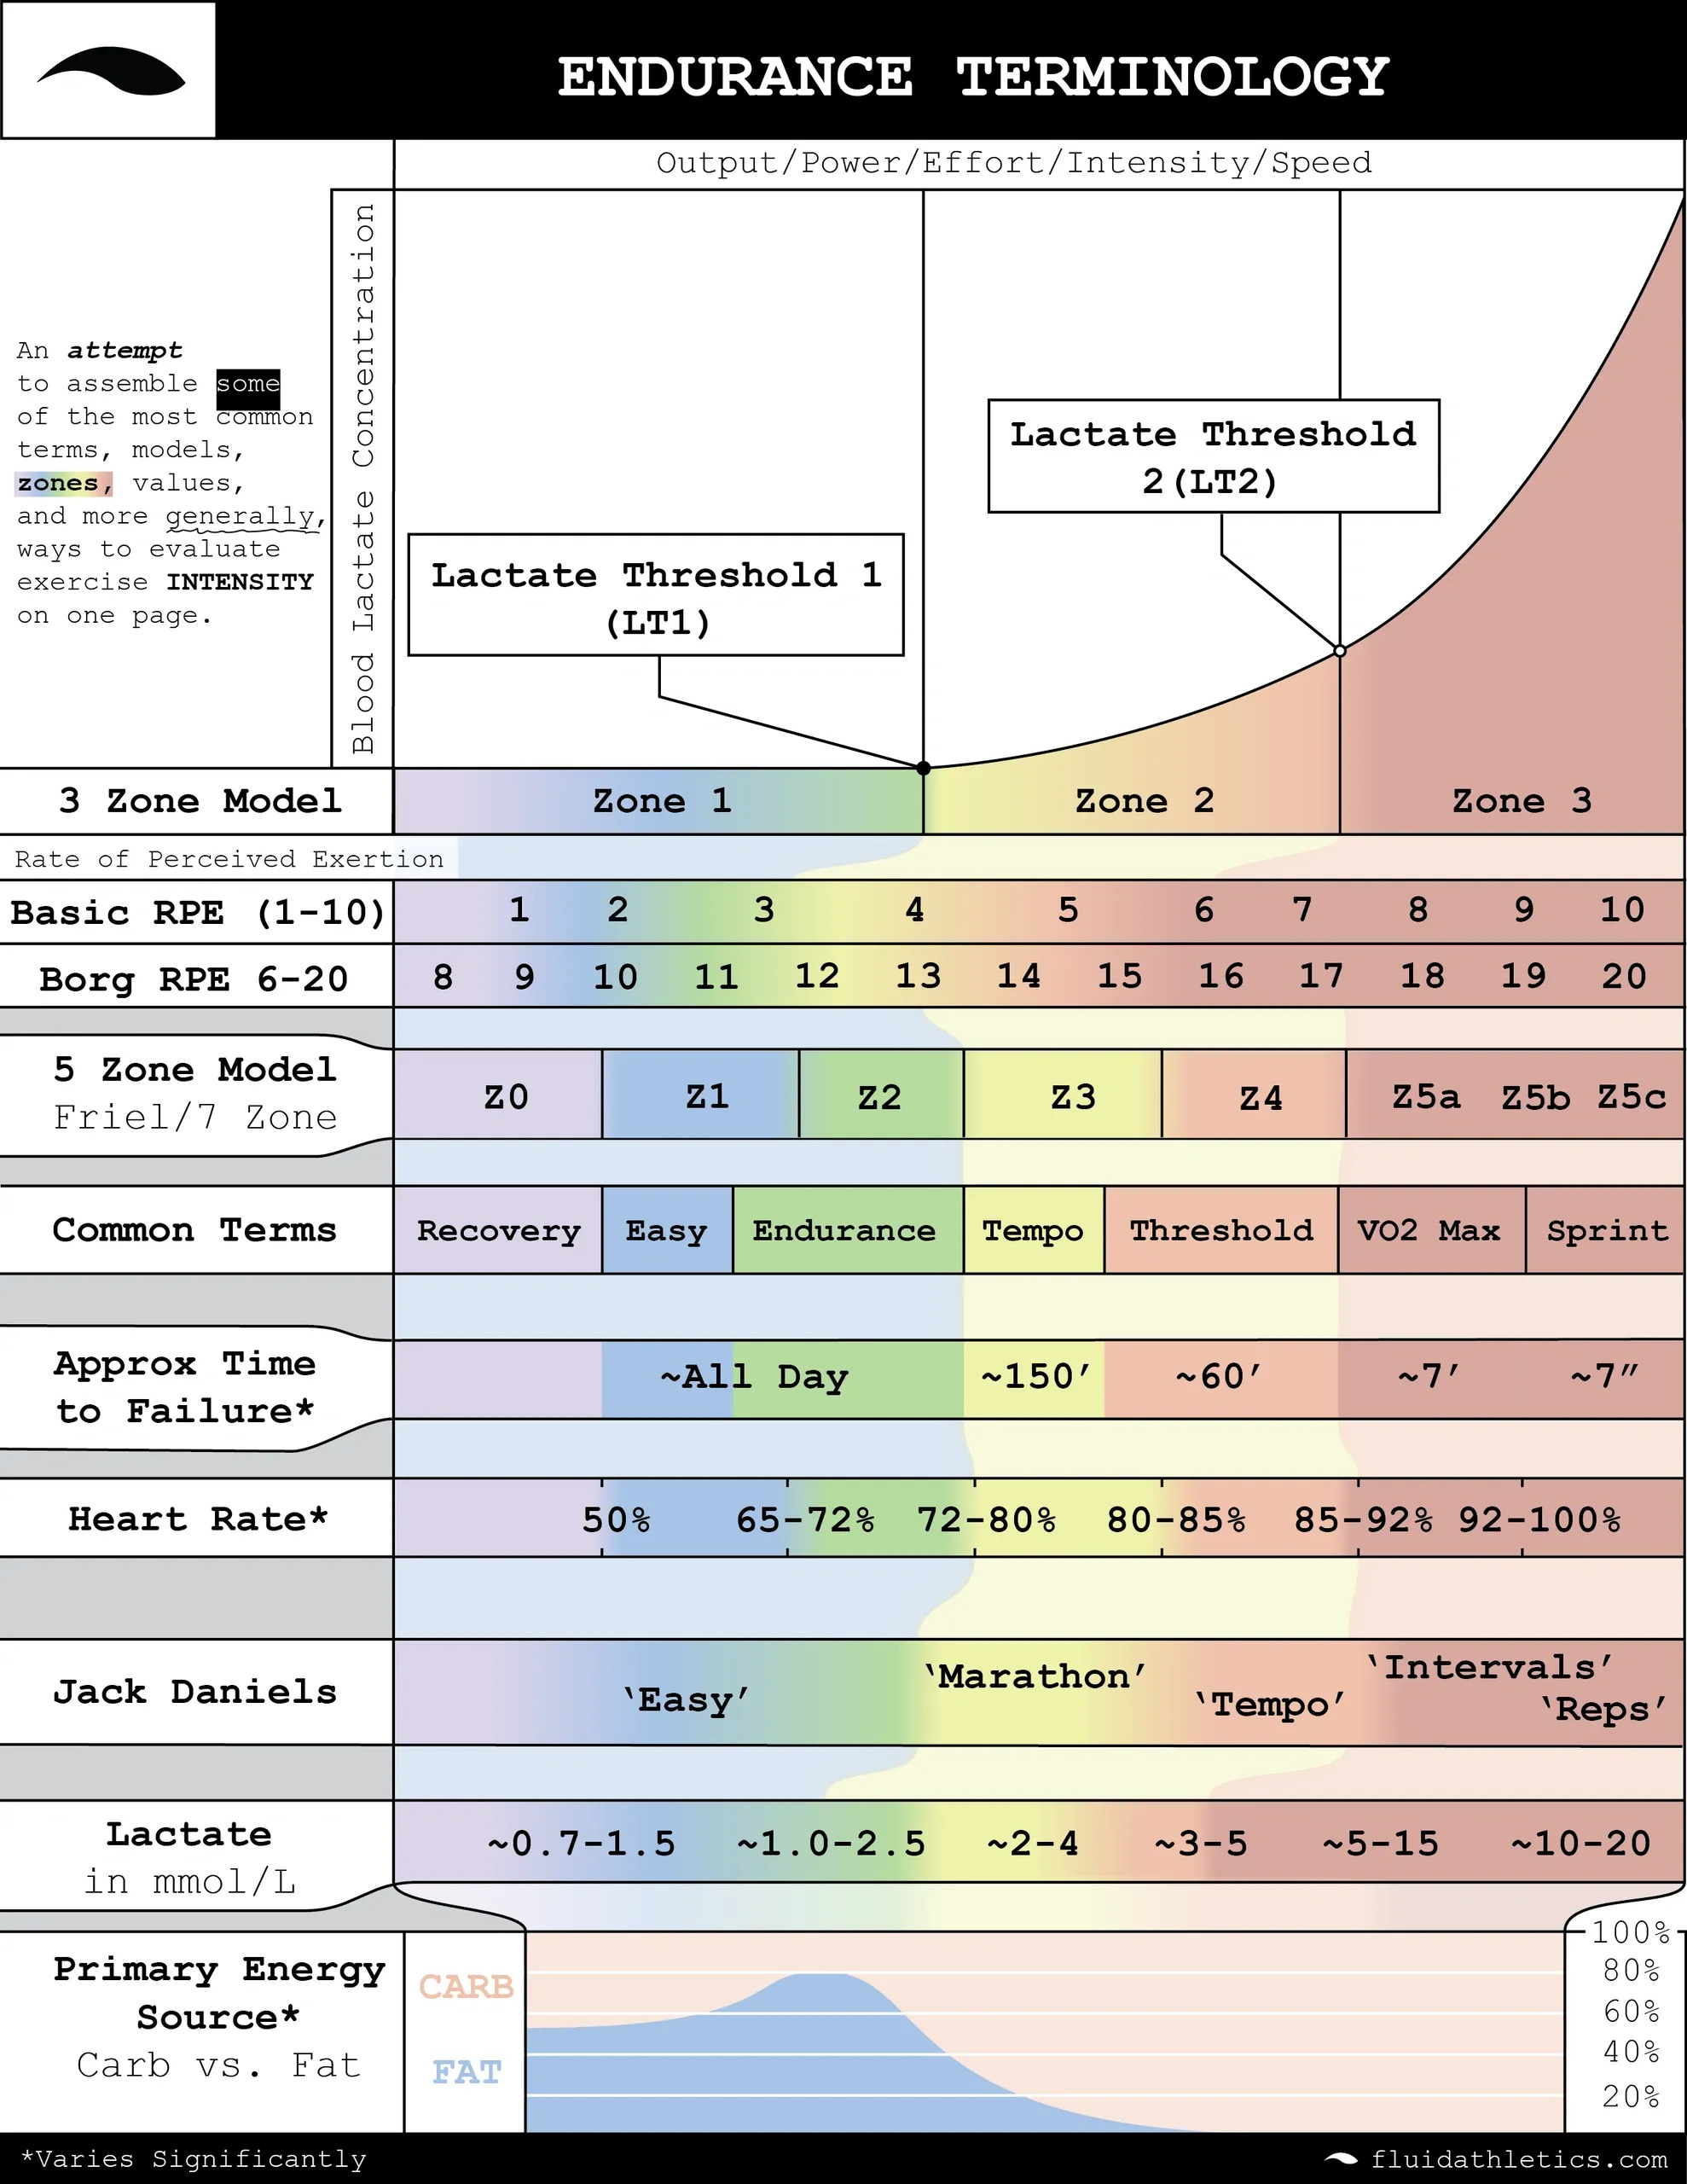
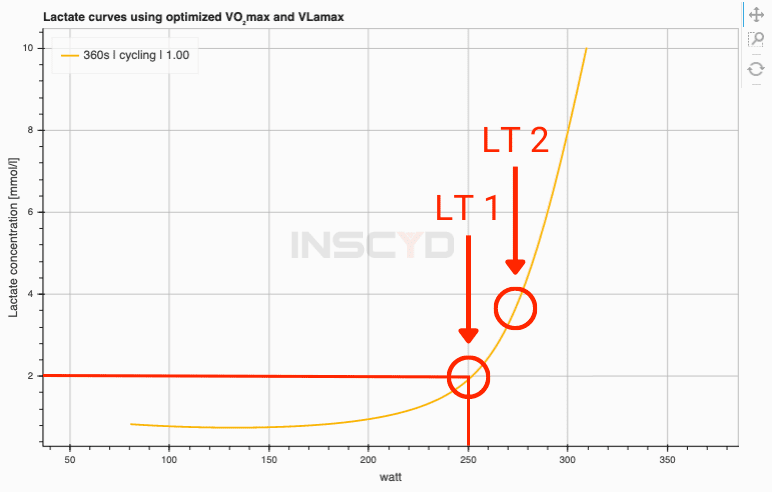
Within the 3-zone model, two lactate threshold markers (LT1 and LT2) are pinned as a metabolic anchor for zone transference and sectioning.
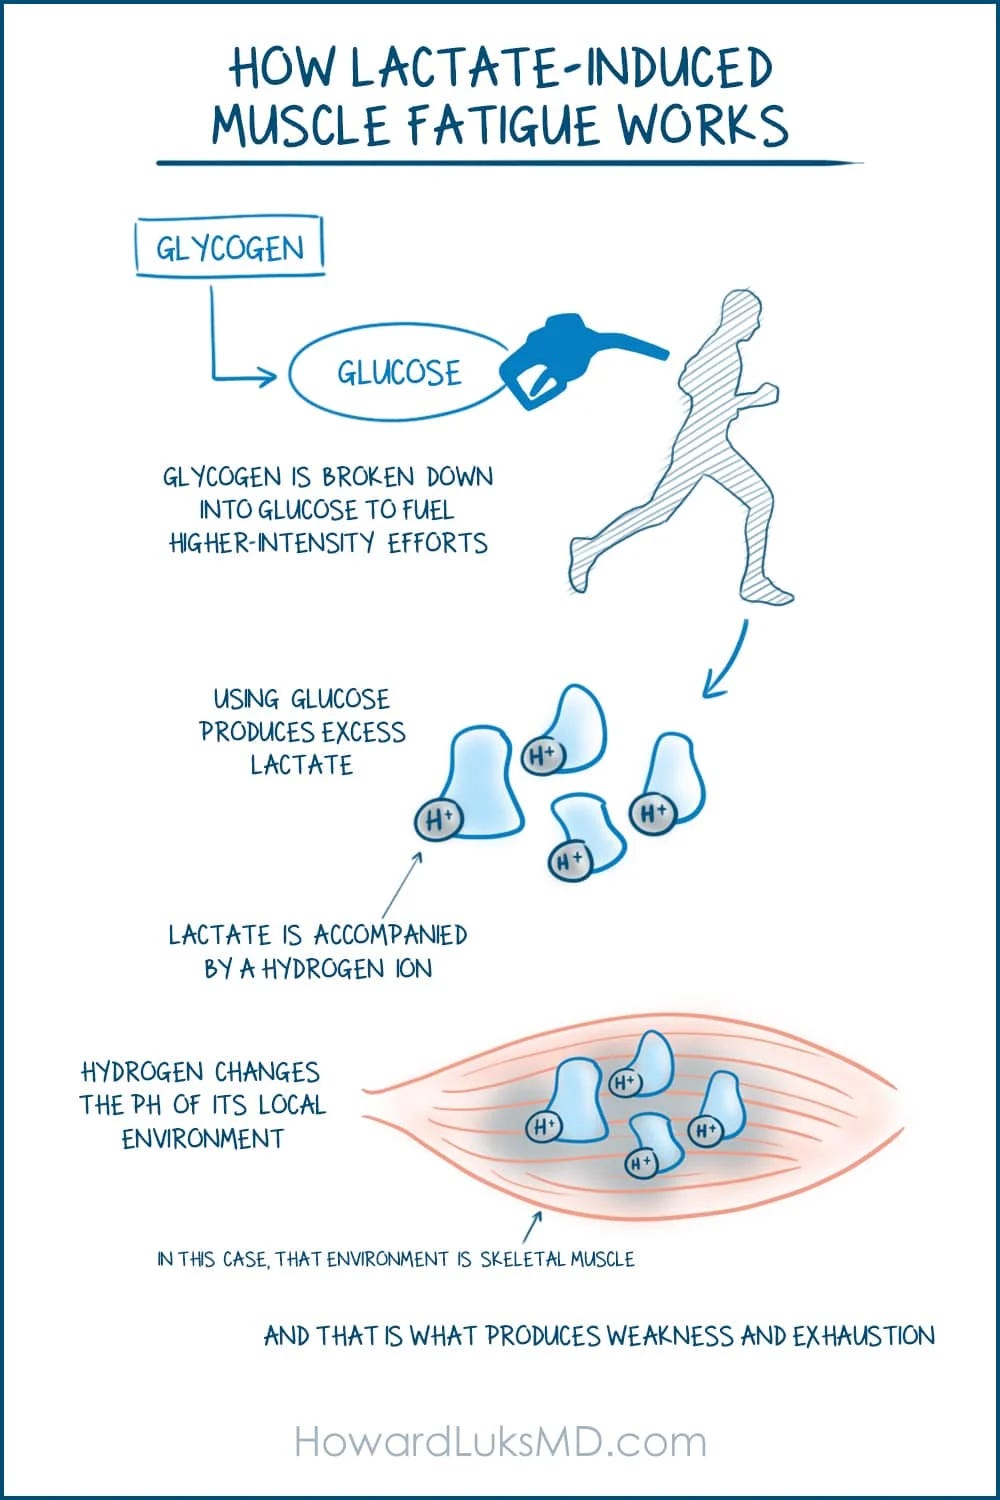
For the purpose of this article, lactate can be broadly defined as a Fuel Source (I bet some of you didn't see that one coming) produced during the utilization of glucose for ATP production. Unfortunately, lactate carries nasty hydrogen ions that change muscle acidity (pH) and increase fatigue.
LT1 and LT2: Metabolic Anchors
Lactate Threshold 1 (LT1): The point at which lactate production begins to rise above baseline (~ 2.0 mmol/L). At LT1, the body can still clear lactate efficiently with minimal fatigue. This is the first “threshold” of a measurable increase in lactate production.
Lactate Threshold 2 (LT2): The point at which lactate production exceeds clearance (~ over 4.0 mmol/L). The rapid accumulation of lactate in the bloodstream results in significant fatigue in athletes.
Note About Lactate Measurements
It is important to note that athletes' physiologies and blood lactate concentrations are incredibly different. Many athletes have LT1 and LT2 anchors different from the approximated 2.0 and 4.0 mmol/L thresholds, respectively.
“I thought zone-based training was about my heart rate? Why are we talking about lactate?”
How does pricking yourself with a lactate meter every day sound? We utilize heart rate because it can be a pretty good proxy for lactate concentration (i.e., fatigue) without turning you into a human pin cushion.
The Zones
All zones will be broken into the following categories: Common Terms, Basic RPE (Rate of Perceived Exertion; 1-10 scale), Uses, Time to Failure, Lactate (mmol/L), Jack Daniels Terminology, and Primary Energy Source.
Zone 1: Below LT1
Common Terms: Low intensity, FatMax zone, Recovery, Easy, Endurance
Basic RPE: 1-4
Uses: Recovery or regeneration runs. Base work training.
Time to Failure: All day with the consideration of training status, hydration, and fueling.
Lactate: ~0.7-2.0
Primary Energy Source: Fat
Jack Daniels Terminology: Easy
Zone 2: Between LT1 and LT2.
Common Terms: Sub-threshold, Anaerobic threshold zone, Tempo, Threshold
Basic RPE: 4-7
Uses: Moderate intensity runs, steady running, tempo work, traditional threshold runs
Time to Failure: Approximately 60 minutes - 2 hours
Lactate: ~2.0-4.0
Primary Energy Source: Carbohydrates
Jack Daniels Terminology: Marathon and Tempo
Zone 3: Above LT2
Common Terms: High intensity, above threshold, VO2 max zone, VO2 max, sprint
Basic RPE: 7-10
Uses: Power and VO2 max builders. Intervals, repetitions, and uphill work at high intensity.
Time to Failure: Approximately 7 minutes for time to failure in VO2 max related efforts. Approximately 7 seconds when considering max-intesnity sprint related efforts.
Lactate: ~4.0-20.0
Primary Energy Source: Carbohydrates
Jack Daniles Terminology: Intervals and Reps
How the 3-Zone Model is Distributed in Training
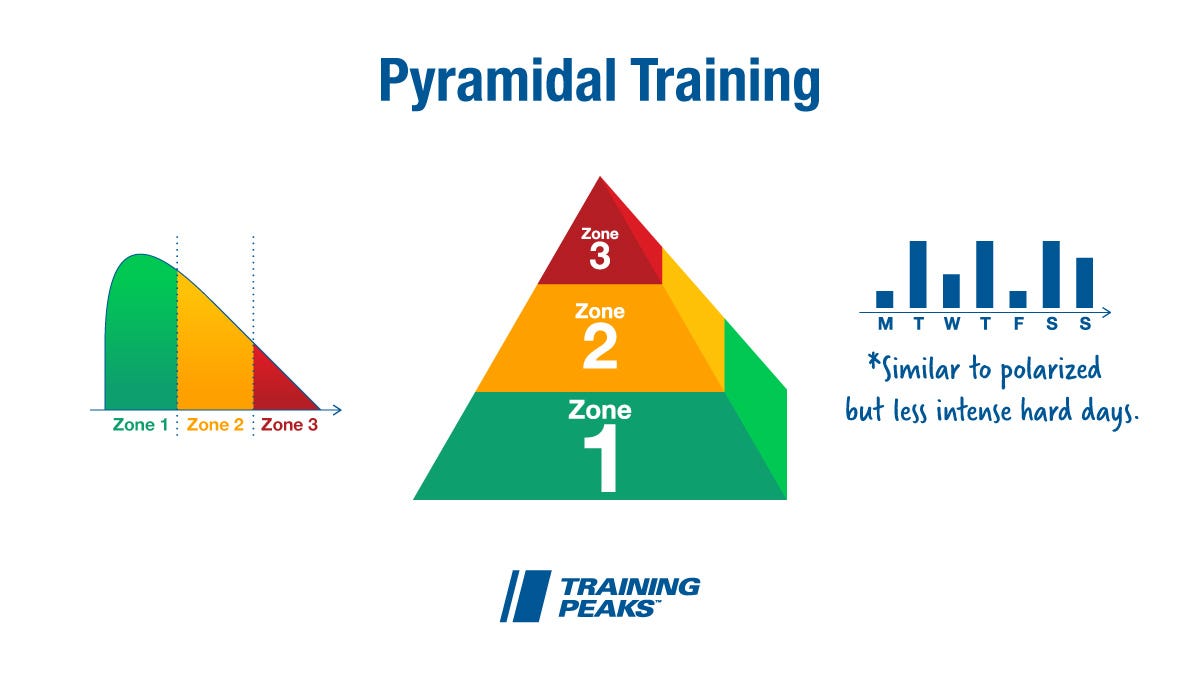
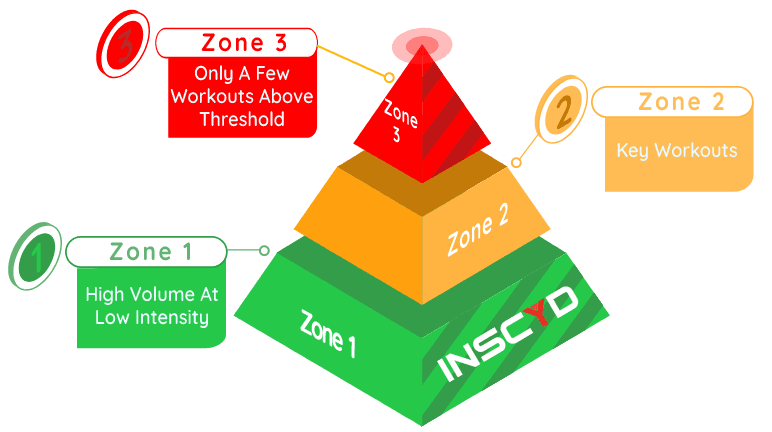
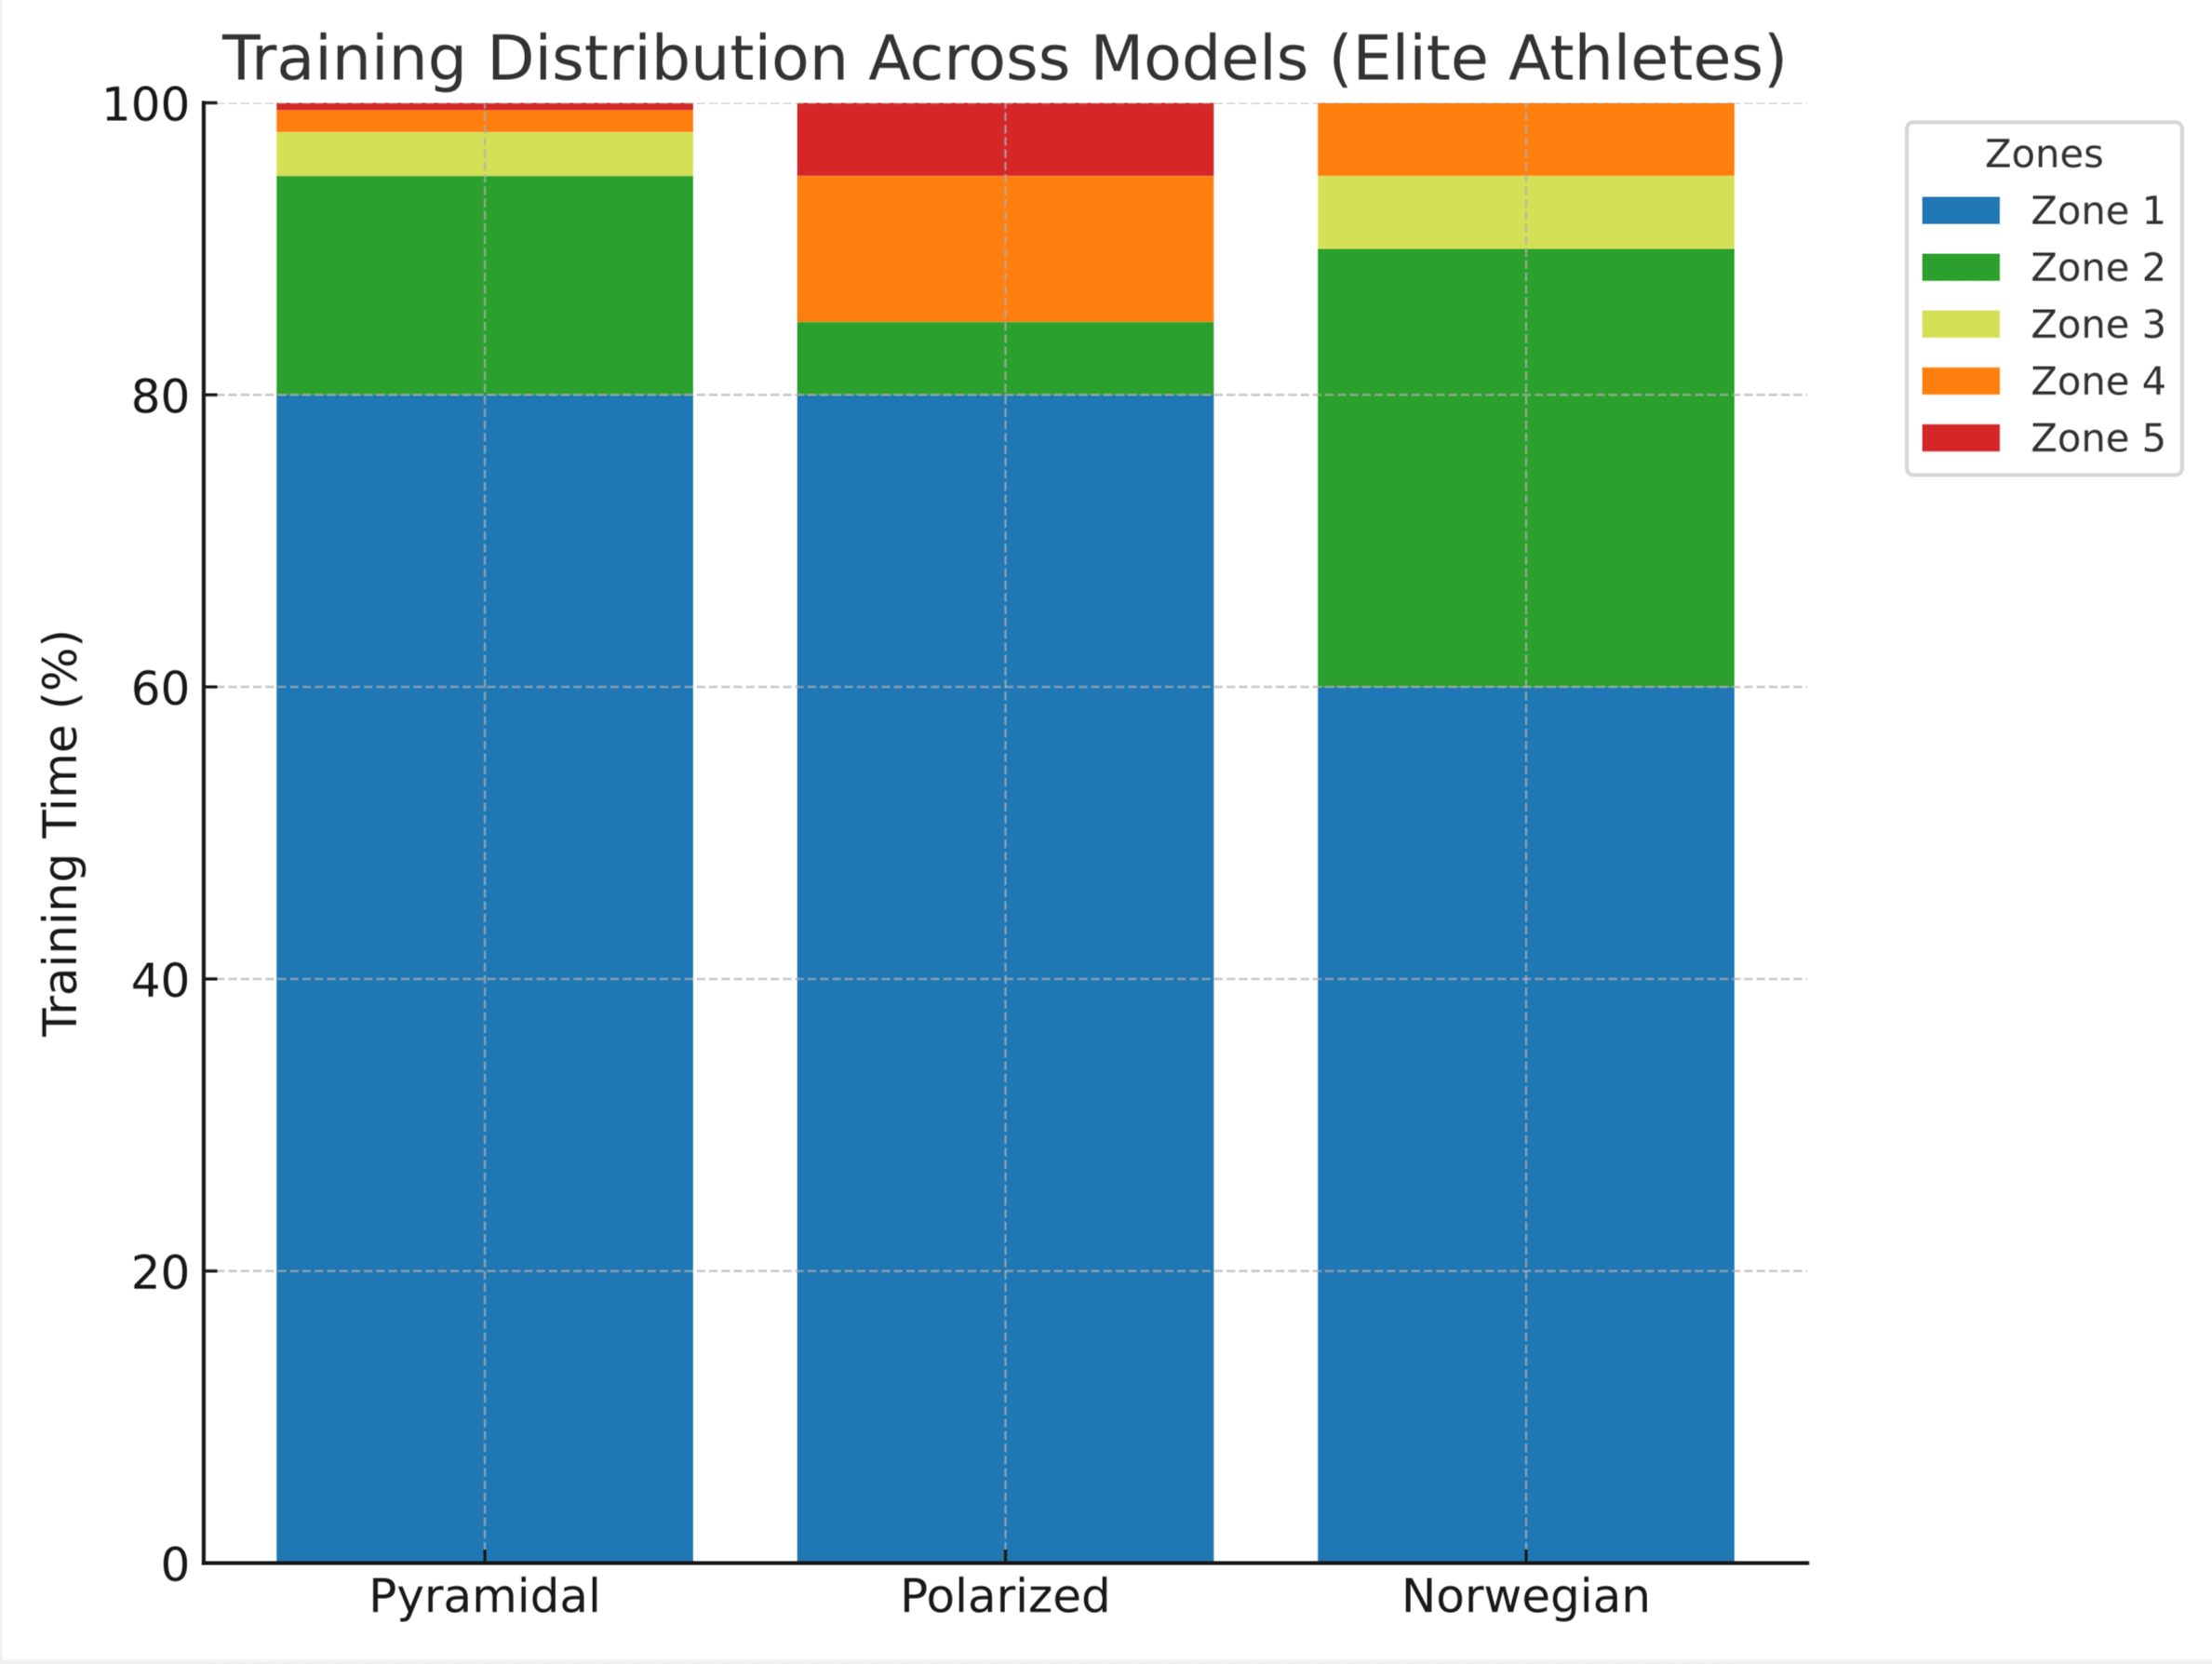
Pyramidal Model: In this model, athletes will spend most of their time in zone 1, a medium amount in zone 2, and a small amount in zone 3. Some approximated numbers would be ~75-85% in Zone 1, ~10-20% in Zone 2, and ~5-10% in Zone 3. In this approach, athletes can build confidence in training with a structured, easy-to-follow plan. Training doesn’t have to be sexy; it just has to work, and the Pyramidal Model is a proven approach.
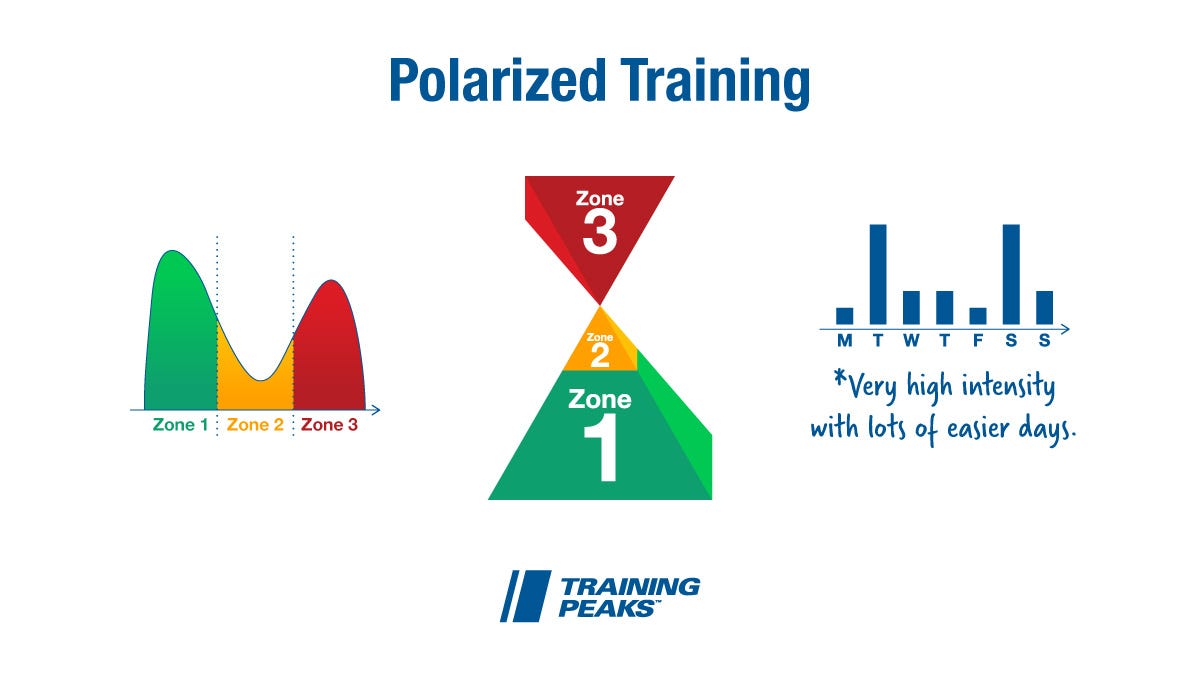
Polarized Model: If you have heard of the commonly coined 80/20 rule (i.e., 80 percent easy training and 20 percent hard), a polarized model would represent a similar approach. Compared to the pyramidal model, Zone 2 and Zone 3 are flipped, with Zone 3 taking on the “medium” amount of work. This model allows athletes to get more work at their top-end speed, hopefully transferring to metabolic and neuromuscular efficiency on harder efforts during a race. Also, there are some theories that working in Zone 3 and boosting VO2 max can additionally facilitate the increase of an athlete's aerobic threshold.
The Norwegian Method: Remember when I said training doesn’t need to be sexy; it just has to work? Now, this is the type of stuff that is sexy and works. Check out The Norwegian Method on YouTube. Some of endurance sports' best athletes are getting after it with this method and racking up views in the process. More time in zone 2, more time in the pain cave, and more time for killer content.
This framework is similar to the pyramidal model approach; however, there is less training in Zone 1 and an increase in Zone 2. Some gross approximations for this would be ~ 60-75% in Zone 1, ~ 20-30% in Zone 2, and a small, concentrated amount in Zone 3. Critical workouts of the Norwegian Method tend to be performed in Zone 2, right below the anaerobic threshold. It can get quite uncomfortable if you have done prolonged work at this rate, maybe a bit like Chinese water torture (which didn’t even originate in China) or Sisyphus and his boulder (which didn't originate in China either).
The 5- Zone Training Model
Like the 3-zone model, the 5-zone model is a staple in endurance training distribution, prescription, and research. The main difference between the two? There are more zones! And let's not even get started on Joel Friels' 7-Zone model, which is fantastic and something I will most likely cover in an additional article. Joel’s name will be brought back up momentarily when calculating HR zones.
To keep things similar to the 3-zone model, I will also provide the 5-zones with their respective categories of Common Terms, Basic RPE (Rate of Perceived Exertion; 1-10 scale), Uses Time to Failure, Lactate (mmol/L), Jack Daniels Terminology, Primary Energy Source, and Lactate Threshold Heart Rate (LTHR; you will learn how to calculate this).
Zone 1
Common Terms: Recovery, regeneration, easy, leisurely jaunt, “I’m bored, is this even doing anything?”
Basic RPE: 1-2
Uses: Recovery and regeneration runs, warm-ups, easy days for higher volume athletes
Time to Failure: All day pace. Again, the caveats of training status, proper hydration, and fueling apply
Lactate: ~0.7-1.5
Jack Daniels Terminology: Easy
Primary Energy Source: Fat
LTHR: Under 80%
Zone 2: Capped at LT1
Common Terms: Endurance, easy, easy to steady, set it and forget it, aerobic, fat-burning, MAF 180
Basic RPE: 3-4
Uses: Long runs, easy days for less advances athletes, recovery floats between intervals.
Time to Failure: Theoretically and in practice, ALL DAY again. During races many elite endurance athletes will set in at the top of their Zone 2 and hold there for prolonged periods of time (e.g., 50-100 mile ultramarathons).
Lactate: ~1.0-2.5
Jack Daniels Terminology: Easy
Primary Energy Source: Fat
LTHR: 80-88%
Zone 3
Common Terms: Tempo, steady, moderate, settling in, gray zone
Basic RPE: 4-5
Uses: Progression runs, steady runs, getting acquainted with a more challening pace, pushing uphill on trails
Time to Failure: Approximately 150 minutes
Lactate: ~2.0-4.0
Jack Daniles Terminology: Marathon
Primary Energy Source: Carbs
LTHR: 89-94%
Zone 4: Capped at LT2
Common Terms: Threshold, moderately hard, 1-hour pace
Basic RPE: 6-7
Uses: Threshold runs, cruise intervals, progression runs (into Zone-4 rather than Zone-3)
Time to Failure: Approximately 60 minutes
Lactate: ~3.0-5.0
Jack Daniels Terminology: Tempo
Primary Energy Source: Carbs
LTHR: 95-100%
Zone 5
Common Terms: VO2 max, power, anaerobic, high-intensity, reps
Basic RPE: 8-10
Uses: Hard/fast intervals and reps, races
Lactate ~ 5.0-20.0
Jack Daniels Terminology: Intervals, reps
Primary Energy Source: Carbs
LTHR: Over 100%
How the 5-Zone Model is Distributed in Training
Similar to the 3-zone model, the 5-zone model can also utilize pyramidal, polarized, or Norwegian training distribution models with a bit more complexity.
The volume of work done in Zone 1 is dependent on training status. Elite athletes will need to spend more time in Zone 1 as the top end of Zone 2 can become a substantial biomechanical stressor. As mentioned in Training for the Uphill Athlete, untrained individuals may be unable to stay in Zone 1 for ‘easy’ or ‘recovery’ days. For this reason almost all easy volume for lesser trained athletes will be in Zone 2 until aerobic adaptations occur.
Calculating Heart Rate Zones
Remember that Joel Friel guy I mentioned earlier? Here is where his name and mythical Lactate Threshold Heart Rate (LTHR) model come into play.
To calculate your heart rate zones follow this model:
Have a reliable tool for measuring heart rate data. Chest straps work best, but arm bands work as well. If you are using a watch, make sure it is tight. There tends to be a lot of variation in watches, so this would be the last option.
Complete a 30-minute time trial (by yourself, no partners, not a race setting). Doing this uphill or on an incline treadmill may be beneficial as it lessens biomechanical stress for the athlete and reduces the importance of speed-related adaptations. In other words, if you are a lesser trained athlete or concerned about biomechanical stress and fatigue, go for the uphill option.
10 minutes into the time trial, hit the lap button.
Look at your average heart rate for the last 20 minutes of the time trial. Essentially, we are looking for a steady LTHR. It may take longer than 10 minutes to achieve this. If that is the case, Sauce for Strava is a great tool for analyzing files with HR variation. Select the area where you notice the HR begins to stabilize.
Set your zones using this model:
Zone 1: under 80% LTHR
Zone 2: 80-88% LTHR
Zone 3: 89-94% LTHR
Zone 4: 95-100% LTHR
Zone 5: above LTHR
Example: 5-Zone Training Distribution with HR Zone Calcluations
For the following zones I calculated a 172 LTHR which was scrubbed from an uphill treadmill interval workout last week. Training distribution is a based on a pyramidal approach.
Zone 1: Under 137bpm. Shared training distribution of 80-90% with Zone 2.
Zone 2: 137-151bpm. Shared training distribution of ~80-90% with Zone 1.
Zone 3: 153-161bpm. Shared training distribution of ~10-15% with Zone 4.
Zone 4: 163-172bpm. Shared training distribution of ~10-15% with Zone 3.
Zone 5: Above 172bpm. Minimal amount of training distribution. Approximately 5% or less.
Wrapping Things Up
We have discussed some basic principles regarding zone-based endurance training and a viable option for calculating heart rate zones. When calculating HR zones, some of you may have noticed prominent methods such as 220-Age, 207 - (Age)(.7), or the Karvonen formula were omitted. Heart rate zones are incredibly idiosyncratic. If the athlete's physiology can be tested, test it, and then re-test it later. Monitor and update. Daily, weekly, montly, and variabilities are present. The given caveats of training status, age, season, temperature, caffeine intake, sleep, diet, current events, family holidays, the Super Bowl, Amazon Prime Day, and a new season of your favorite TV series apply.
This article was primarily informed by the infographic provided by Fluid Athletics and critical pieces of writing, such as David Roche’s Everything You Need to Know About Heart Rate Zones. Take the picture with you. Read David’s stuff. I am simply a man who learns by writing and wants to help others learn in the process.